
At SmartSense, we go beyond monitoring the temperature of your assets—we also monitor our own system of sensors to ensure that we get all of the temperature readings when they’re expected.
SmartSense customers span across multiple industries and deploy our systems for myriad reasons. Most of their needs fall into three broad categories: real-time alerting, analytics, and regulatory compliance. To assist our clients, our sensors need to have a complete, real-time view of the cooler or freezer in which they’re placed. Not having this view could be detrimental as, for example, a client’s cooler full of temperature-sensitive medicine or fresh produce may just go out of its temperature range at the exact time that the sensor has connectivity issues. Incidents like this can prevent our client from using our sensors to gain real-time visibility into their equipment and see out of range incidents.
Our sensors have an adjustable reporting interval with a default interval of 15 minutes. This means we would expect a sensor to send a temperature reading every 15 minutes, or 96 readings in a day. If there’s a connectivity issue, Sensor Cloud might not receive all 96 readings from the sensor—which indicates it is missing, or it might not receive the readings immediately which indicates it is delayed.
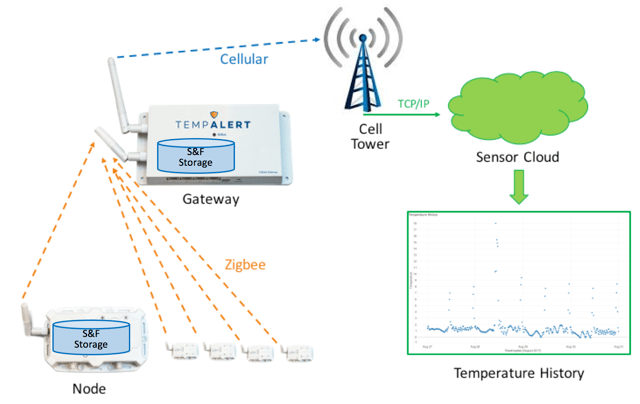
As seen in the diagram below, temperature readings are transmitted from the sensors inside the client’s equipment to the gateway in the store over a Zigbee wireless channel. It’s then further transmitted from the gateway to a carrier over a cellular connection like Verizon or AT&T. From the cell tower, it’s sent via TCP/IP to our data storage in the cloud. Connectivity issues can take place on any of the steps data has to take from the sensor to the cloud.
The most common causes of connectivity issues at our client’s sites are:
- Gateway is unplugged or has been thrown out.
- Gateway is located in a part of the room that has poor cellular connection or is a network dead zone.
- The node is transmitting through an imperfect Zigbee channel.
- Someone removed the sensor and discarded it.
- Cellular connection has gone down.
- Interference exists from other nearby wireless equipment.
We have a ‘Store and Forward’ mechanism in place which acts as a safety net in case of connectivity issues when the data cannot be sent to the cloud. Our sensors and gateways have internal storage where the data is placed when immediate transmission isn’t an option. That stored data is then sent forward when the connection is available again. Customers can monitor connectivity issues by configuring their system settings to generate missed report alerts in case the temperature reading doesn’t reach our software platform within a safe time period.
SmartSense also proactively monitors and remedies any connectivity issue by detecting patterns in network issues. To do so, we defined two basic network robustness measures that allow us to quantify connectivity and better identify patterns. The metrics are defined on a scale of 0–1 with a goal to get each to 1.
- Coverage: This metric answers the question “Is the data getting through?” It’s the portion of expected data available in sensor cloud. If we have all the data for a particular device for a particular time period, its coverage value would be 1 for that time frame; if we had 50 percent of the data, then the value would be 0.5 and so on. We normally expect ‘Store and Forward’ to fill in the data for problematic transmission conditions, so values for our clients are close or equal to 1.
- Online: This metric answers the question “Is the data getting through without delay?” It’s the portion of expected data that arrived without delay in sensor cloud. A reading is classified as delayed if it crosses a threshold which is normally equal to 15 minutes, or 1 reporting interval. Online has a value of 1 for a time period for a device if all data arrives on time, 0.5 if 50 percent of readings are delayed and so on for that particular time frame.
Quantifying connectivity issues enables us to evaluate problems at store level, geographically, and also allows us to look at it historically. Each cause of a connectivity problem has a distinctive pattern when looked at in a group of time series data. In our next blog post, we’ll cover how to use the network robustness metrics as a time series to identify patterns in connectivity issues and how to remedy those problems with the help of different use cases.
Subscribe to Our Blog!
Interested in learning more about our remote monitoring technology and analytics? Subscribe to our blog!