In our complex global economy, implementing Sensing-as-a-Service solutions for supply chain tracking is critical. Industries such as food service, healthcare,...
Read More
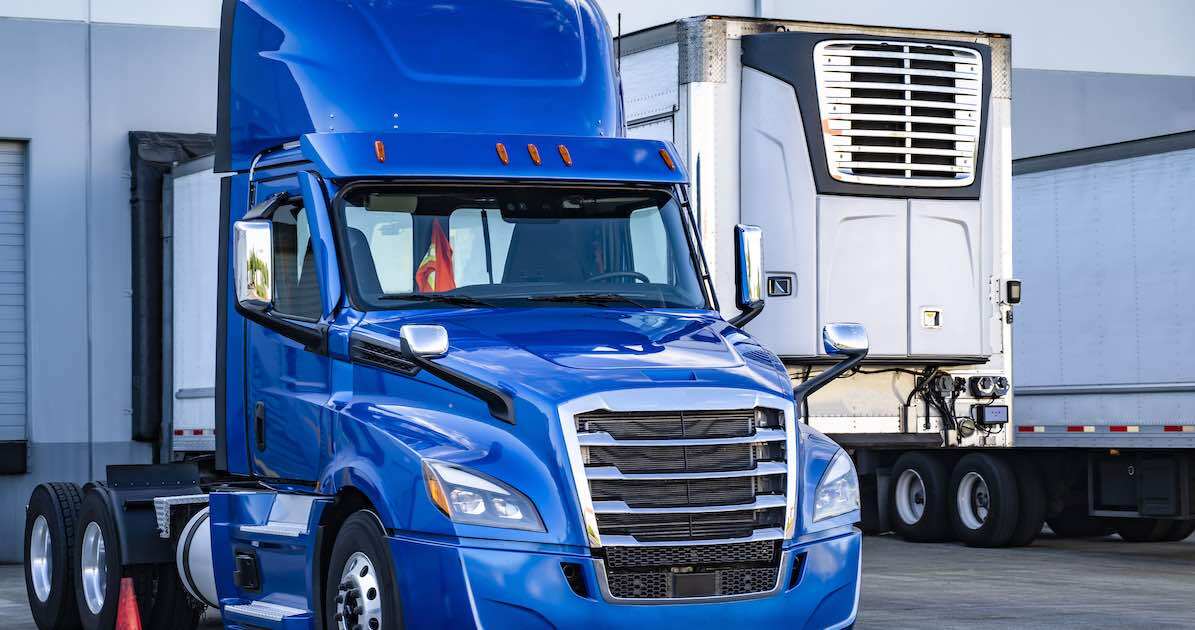
As the global logistics and transportation industry becomes increasingly interconnected, cargo theft has soared to a 10-year high. According to a recent report, incidents increased 46% in the first quarter of 2024 compared to the first quarter in 2023.This upsurge signals an urgent need for expanded security measures. In response, business leaders are adopting IoT monitoring of product location and condition to...

Leading healthcare organizations are expanding sensorability across their assets to improve health outcomes. Sensorability combines IoT technologies with fuzzy logic and artificial neural networks to manage assets and inventories, thereby maximizing on-shelf availability while reducing unnecessary costs.In the healthcare sector specifically, sensorability refers to the capacity of an integrated network of assets to...

Leaders in the food and healthcare industries increasingly believe that the cost of sustainability efforts saves their enterprises money over the long term while also saving the planet. Consumers, too, are willing to pay for the rising costs of goods if they are sustainably sourced, manufactured, and transported. Even so, until recently many CEOs have hesitated to invest in sustainability efforts because they lacked...

The food service industry is undergoing an era of labor uncertainty and demand volatility. The reasons are many and complex: the rise of e-commerce, supply change disruptions due to natural catastrophes brought on by climate-change, and higher expectations of consumers regarding safety, quality, and sustainability. On top of all that, the FDA’s new 2026 traceability regulations loom on the horizon. The bottom line...
Wholesalers and retailers in the food manufacturing and pharmaceutical industries must ensure the effective delivery of pathogen-free food and critical medications to their customers who rely on them for their health and well-being. To do so successfully requires accurate, real-time data across the cold chain, from the manufacturing floor to the warehouse to point of sale.It is, therefore, a top priority for...